
雅思小作文曲线图攻略及范文
2016-03-16编辑: 环球教育来自: 环球教育整理
下面小编为大家整理了雅思小作文曲线图攻略及范文,供考生们参考,以下是详细内容。
曲线图 范文 1(引题段):
【第一句】The curve illustrates the number of cases of A-type crimes committed in the UK between the years 1990 and 2004.【第二句】It can be seen that A-type crimes decreased dramatically to 200 cases around the middle of the 1990s and then increased to 2000 before the year 2000.
范文 2:(全文)
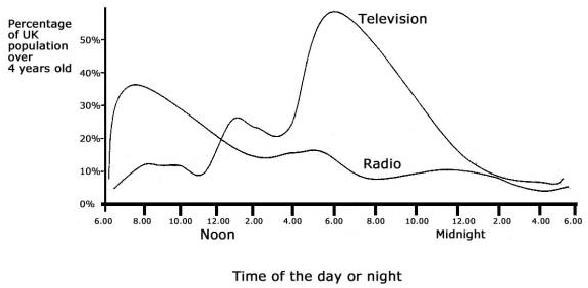
From the graph, we can see clearly that in the early morning, at 6 a.m., few people watch TV. However, from this time onwards, the number of TV audience is on the rise. At noon, the people watching TV account for about 8% of the total population. In the period between 12:00 and 2:00 p.m., the TV audience experiences a sharp increase from 8% to approximately 18%.
From 2:00 p.m. to 4:00 p.m., the figure remains constant at about 18%, then balloons to the peak of the day, reaching approximately 50%. The number of TV audiences drops dramatically from 10 p.m. till it reaches its bottom at 3 p.m.
On the other hand, there is a sharp increase in radio audience from 6.a.m to 9 a.m., peaking at about 28% at 8:30 a.m. However, from this point onwards, it declines gradually for the rest of the day, bottoming out at 4:00 a.m. the next day.
In brief, the number of TV and radio audiences varies according to different phases of time probably due to the different features of these two media.
以上就是小编为大家整理的雅思小作文曲线图攻略及范文,非常实用。最后预祝大家在雅思考试中取得好成绩!

相关阅读

-
预约雅思水平在线测试
获取0元体验课程