看雅思考官是如何写雅思图表作文
2016-09-28编辑: Jennifer来自: 环球教育深圳学校史凯齐
六组以上数据的写法
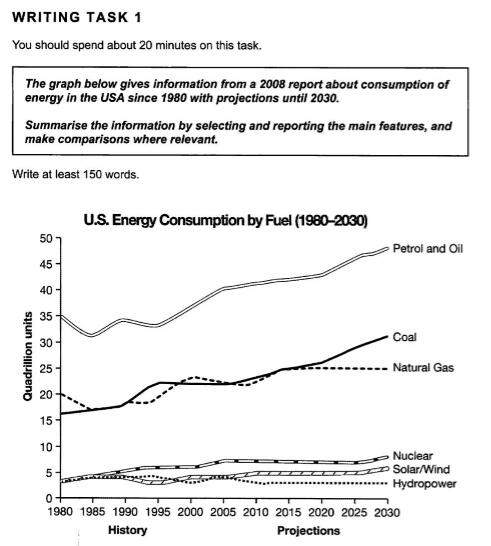
个别时候会遇到极其变态的多数据图,例如剑9六线图(P101)

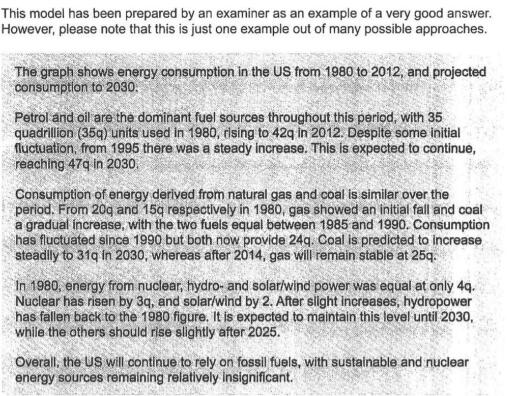
这么多条线如果不大刀阔斧地合并的话,30分钟都写不完。我们看看考官范文如何处理

六条线被考官合并为三条,中等高度的两条放在一起写,最低的三条放在一起写。
现实考试中,比例最高的是柱状图,来看一个多数据柱图。
The graph shows estimated oil production capacity for several Gulf countries between 1990 and 2010.
范文:(重点在合并)
The graph shows Oil Production Capacity in millions of barrels per day for selected Gulf countries. There are several features in this graph.

The most significant feature is that oil production will increase sharply in almost all the countries shown. Kuwait and Iraq are both expected to double their output between 1990 and 2010, with Kuwait's production rising from 1.8 million barrels per day (bpd) in 1990 to 3.8 in 2010. Iran will also increase its output by a slightly smaller amount. After remaining steady at 2.5 million bpd from 1990 to 2000, the UAE's output is expected to approach 4.0 million bpd in 2010. Only Qatar's production is predicted to fall, back to 0.8 million bpd after a slight rise in 2000.
However, the greatest increase will be from Saudi Arabia. In 1990, its output capacity at 8.5 million bpd exceeded the combined production of Iran, Iraq and Kuwait. This lead is expected to continue with a 75% increase in production to 14.5 million bpd 2010.
In summary, while most of the countries are expected to show increases, Saudi Arabia will maintain and strengthen its position as the major producer.
(191 words)
范文中伊朗、伊拉克、科威特三国的趋势特征都有写到,但是具体的数值只写了科威特。所以,六组以上数据的名字和特性都必须要写到,但是具体数值选择性描写。
以上就是结合雅思剑桥真题,分析考官对于雅思作文写作思路是怎样的。同学们可以结合自己的作文来进行比较,小编认为也许范文不是所有答案中最好的一篇,但确实可以体现高分的思路,毕竟对于考试来说能够有一个比较高的成绩是首要的目标呢。
热门推荐

相关阅读

-
预约雅思水平在线测试
获取0元体验课程


