雅思小作文饼图范文解析
2016-05-12编辑: 环球雅思来自:
饼图是雅思小作文的常考题型之一,其写作非常值得我们的深入研究,环球教育给大家整理了一篇关于饼图的范文,同学们可以来看看。
写作题目:
WRITING TASK 1:
You should spend about 20 minutes on this task.
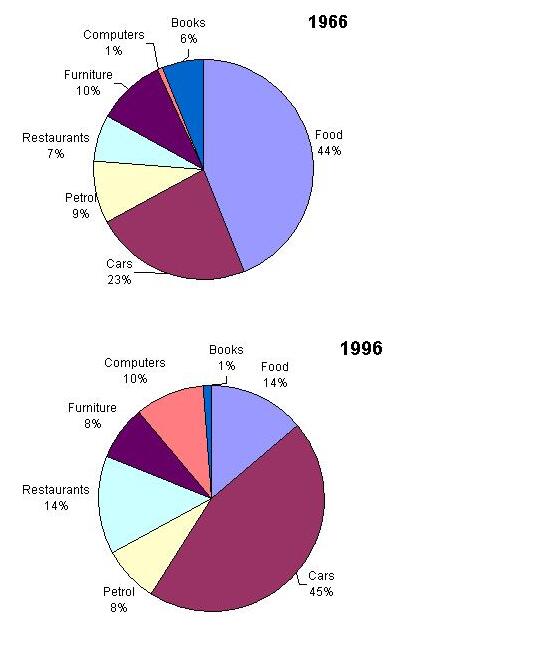
* The charts below show US spending patterns from 1966 to 1996.
* Summarise the information by selecting and reporting the main features, and make comparisons where relevant.
You should write at least 150 words.

写作范例:
The piecharts show changes in American spending patterns between 1966 and 1996.
Food and cars made up the two biggest items of expenditure in both years. Together they comprised over half of household spending. Food accounted for 44% of spending in 1966, but this dropped by two thirds to 14% in 1996. However, the outlay on cars doubled, rising from 23% in 1966 to 45% in 1996.
Other areas changed significantly. Spending on eating out doubled, climbing from 7% to 14%. The proportion of salary spent on computers increased dramatically, up from 1% in 1996 to 10% in 1996. However, as computer expenditure rose, the percentage of outlay on books plunged from 6% to 1%.
Some areas remained relatively unchanged. Americans spent approximately the same amount of salary on petrol and furniture in both years.
In conclusion, increased amounts spent on cars, computers, and eating out were made up for by drops in expenditure on food and books.
以上就是关于雅思小作文饼图的具体内容,希望各位烤鸭们都能够好好看看,也希望对大家的考试有所帮助。
精彩推荐:

相关阅读

-
预约雅思水平在线测试
获取0元体验课程


